Long-Horizon Risk and Interest Rate Sensitivity in Nigerian Pension Funds
Long-Horizon Risk and Interest Rate Sensitivity in Nigerian Pension Funds
1. Introduction
A lower allocation to equities does not necessarily imply a lower-risk portfolio. Where fixed-income assets dominate, interest-rate and duration risk can become important sources of portfolio risk, particularly over longer horizons.
Retirement provision under the Nigerian Contributory Pension Scheme (CPS) takes place within a Multi-Fund Structure regulated by the National Pension Commission (PenCom). The structure consists of six named funds, Funds I - VI. The first two are aimed at workers under the age of 50 and feature an aggressive allocation to non-fixed income assets. Workers over the age of 50 transition to Fund III with a more constrained non-fixed income allowance; Fund IV is the designated retiree fund featuring a modest variable asset allocation. Fund V caters to Personal Pension Plan contributors and has no specific age restriction. Fund VI is the Sharia-compliant retirement vehicle and is therefore out of scope for the remainder of this note.
Using the GALM™ Economic Scenario Generator to produce scenarios over a ten-year horizon, we examine the growth paths of Funds I through V under three FGN yield regimes: low, moderate, and high. The analysis provides an estimate of the differential impact of alternative interest rate pathways on growth outcomes. The mean unconditional continuously compounded growth rate of Funds I - V lies between 15.5% and 18.1% with the equity-heavy Funds I and II in the lead. In addition, the growth differential between the high and low bond yield regimes widens from -4.56% for Fund I to -5.37% for Fund V.
These figures suggest a portfolio that appears safer on the basis of its static volatility or asset allocation may be more vulnerable to an adverse interest-rate regime over the investment horizon.
2. RSA Fund Asset Allocation
PenCom in its Unaudited Report on Pension Funds Industry Portfolio [1] reports detailed allocation data across a broad range of individual instruments and asset categories. For our analysis, we found it meaningful to consolidate these reported categories into five broader risk classes: equities, corporate debt, government debt, real estate, and cash/other assets. The mapping from PenCom’s reported categories to these five modelled classes is set out in Table A1. Table 1 presents the resulting asset-class allocation for RSA Funds I - V as of 30 June 2026 and provides the basis for the projections that follow.
Table 1 - RSA Funds I - V Asset Class Allocations (%)
| Fund | Equities | Corporate Debt | Government Debt | Real Estate | Cash / Other | Combined Fixed Income |
|---|---|---|---|---|---|---|
| Fund I | 37.83 | 5.38 | 54.59 | 2.23 | 2.48 | 59.97% |
| Fund II | 33.20 | 5.32 | 58.53 | 2.57 | 1.77 | 63.85% |
| Fund III | 14.68 | 6.22 | 78.15 | 0.37 | 1.28 | 84.37% |
| Fund IV | 5.51 | 6.38 | 86.46 | 0.25 | 1.72 | 92.84% |
| Fund V | 3.36 | 0.29 | 92.51 | -- | 3.84 | 92.80% |
The combined exposure to government and corporate debt rises from approximately 60% in Fund I to over 92% in Funds IV and V, while equity exposure falls from 37.8% to just 3.4%. Hence, Funds IV and V would ordinarily be expected to exhibit lower portfolio volatility given their small equity allocations. On the other hand, the high fixed income concentration signals a greater susceptibility to duration risk. The question, therefore, is to what extent do differences in fixed income concentration affect growth outcomes under alternative bond yield regimes.
3. Fund Performance & Sensitivity
The return performance of the five funds is projected using the GALM platform, which generates a calibrated set of joint economic scenarios - covering FGN yields, NGX equities, property, foreign exchange, and inflation - and values each portfolio along every path. To evaluate a consistent mandate across shifting interest rate regimes rather than a drifting buy-and-hold book, portfolios are rebalanced each year back to their target June 2026 asset allocation.
To capture market dynamics accurately, five thousand ten-year paths are simulated jointly. This process preserves non-linear dependencies and tail co-movement, ensuring that interest rates, equity returns, and inflation remain internally consistent even under extreme market conditions. Finally, to analyze performance across different yield environments, the simulated trials are sorted into quintiles (Q1 - Q5) based on the terminal ten-year FGN benchmark yield at the end of projection Year 10.
Table 2 - Quintile ranges (terminal FGN 10y yield)
| Quintile | Range | Median |
|---|---|---|
| Q1 (low yield regime) | < 11.47% | 10.34% |
| Q2 | 11.47% - 13.27% | 12.41% |
| Q3 (moderate yield regime) | 13.27% - 15.14% | 14.19% |
| Q4 | 15.14% - 17.58% | 16.25% |
| Q5 (high yield regime) | ≥ 17.58% | 19.72% |
Table 2 reports the range and median of the 5 bond yield quintiles that form the basis of the three rate regimes: low, moderate, and high. The regimes are mapped to the first, third, and fifth quintiles, respectively. For example, the low rate regime corresponds to a terminal bond yield less than 11.47%. The starting yield across all trials is 16.96%, placing the model's base between Q4 and Q5.
Figure 1 - Median projected value of ₦1 by fund and rate regime
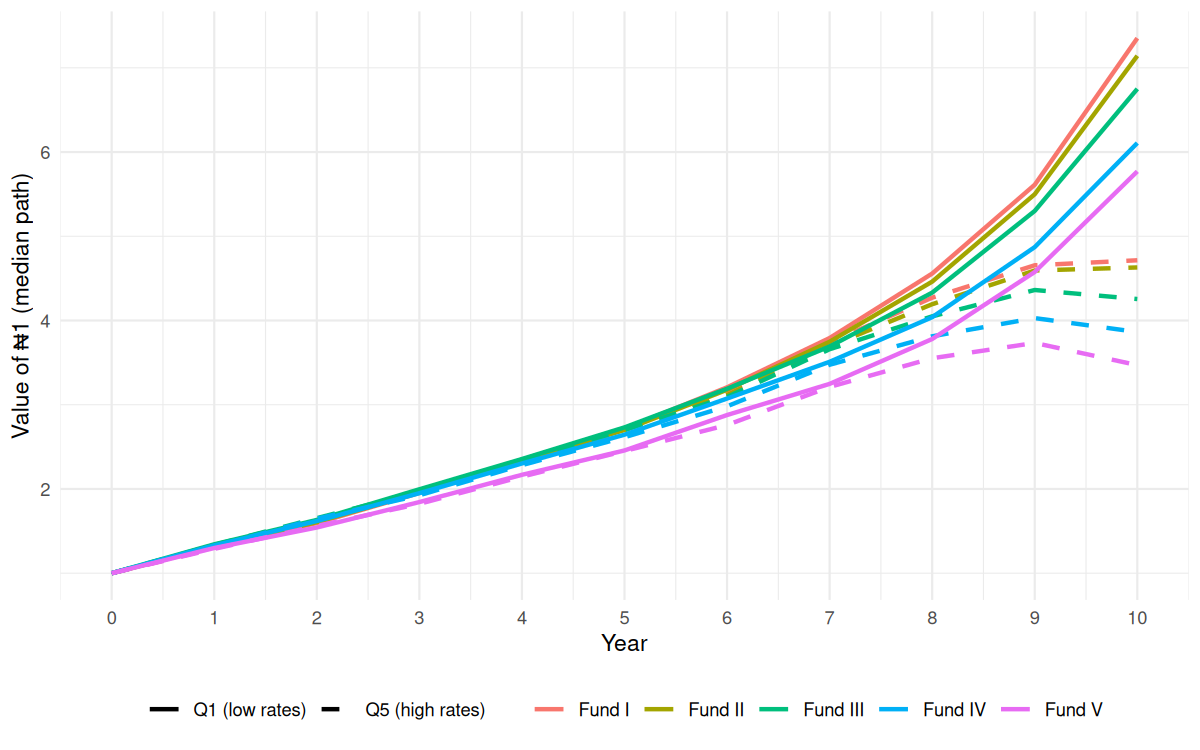
Figure 1 depicts the pointwise median paths in the lowest-rate quintile (Q1, solid) and the highest-rate quintile (Q5, dashed). The figure demonstrates what happens as one goes from the favorable low bond yield regime to the unfavorable high bond yield environment. Up to Year 5 in the projection, performance across funds and bond yield regimes remains clustered around an annualized growth rate in the range of 17.9% - 20.1%. Beyond Year 5, differences in yield sensitivity start to affect growth trajectories. By Year 8 of the projection, there is a clear separation by bond yield regimes and fixed income concentration. The spread between the two groups is widest for Fund V by Year 10.
Table 3 - Measured 10-Year Annual Growth by Rate Quintile
| Fund Structure | Uncond. Mean | Low (Q1) | Moderate (Q3) | High (Q5) | Δ = Q5 - Q1 |
|---|---|---|---|---|---|
| Fund I | 18.11% | 20.10% | 18.34% | 15.54% | -4.56% |
| Fund II | 17.86% | 19.83% | 18.09% | 15.32% | -4.51% |
| Fund III | 17.14% | 19.22% | 17.43% | 14.40% | -4.82% |
| Fund IV | 16.22% | 18.29% | 16.52% | 13.48% | -4.81% |
| Fund V | 15.50% | 17.80% | 15.83% | 12.43% | -5.37% |
The primary insight of Table 3 is as follows:
- The width of the conditional growth range ($\Delta$) scales generally with fixed-income allocation weight. Fund I (lowest fixed-income weight) exhibits the narrowest range at -4.56%, while Fund V (highest fixed-income weight) exhibits the widest range at -5.37%. Thus, the ranking of funds by static portfolio volatility does not necessarily persist when risk is evaluated conditional on the terminal interest-rate environment.
- Moreover, for the moderate bond yield regime (Q3), Fund IV and Fund V experience the lowest compounded growth rates among the five funds. The key distinction between these two conservative pools is therefore not baseline growth, but sensitivity to the interest-rate environment.
4. Conclusion
A direct ranking of portfolio risk using a risk metric such as portfolio standard deviation only tells part of the risk story; such a ranking does not fully capture how portfolio risk evolves over horizons beyond one year. Using the GALM platform, we analyze the dynamic long-horizon risk embedded in Funds I - V. The analysis suggests that conditional on the bond yield regime that materializes in the future, the fixed-income-heavy funds may in fact be riskier than funds that appear more volatile on the basis of standard deviation or portfolio composition alone.
About GALM
GALM builds calibrated, documented economic scenario generators and asset-liability management frameworks, fitted to each client's market.
Learn about GALM · Request economic scenarios
Appendix
Table A1 - PenCom lines to GALM classes
| PenCom reported line | GALM class |
|---|---|
| Domestic shares, foreign shares, mutual funds, open/close funds, private equity | Equities |
| Corporate debt | Corporate Debt |
| FGN securities, state bonds, money market, foreign money market, supranational bonds | Government Debt |
| Real estate, infrastructure funds, REITs | Real Estate |
| Cash and other assets | Cash / Other |
Table A2 - GALM asset-class mix (% of fund NAV)
| Fund type | Equities | Corporate Debt | Government Debt | Real Estate | Cash / Other |
|---|---|---|---|---|---|
| AES | 13.12% | 4.38% | 76.66% | 3.72% | 3.01% |
| CPFA | 18.56% | 25.27% | 53.33% | 3.44% | 0.89% |
| RSA Fund I | 37.83% | 5.38% | 54.59% | 2.23% | 2.48% |
| RSA Fund II | 33.20% | 5.32% | 58.53% | 2.57% | 1.77% |
| RSA Fund III | 14.68% | 6.22% | 78.15% | 0.37% | 1.28% |
| RSA Fund IV | 5.51% | 6.38% | 86.46% | 0.25% | 1.72% |
| RSA Fund V | 3.36% | 0.29% | 92.51% | 0.00% | 3.84% |
| RSA Fund VI | 27.86% | 1.41% | 69.52% | 0.41% | 2.24% |
| RSA Fund VI (retiree) | 6.74% | 2.59% | 89.14% | 0.35% | 2.54% |
Table A3 - GALM Government bond allocation by tenor
| Fund | 1y | 5y | 7y | 15y |
|---|---|---|---|---|
| Fund I | 20.6% | 5.3% | 10.6% | 63.5% |
| Fund II | 16.4% | 9.3% | 18.6% | 55.7% |
| Fund III | 19.0% | 9.5% | 28.6% | 42.9% |
| Fund IV | 28.5% | 9.6% | 27.9% | 34.0% |
| Fund V | 43.7% | 6.6% | 16.6% | 33.1% |
Allocation based on data from [1] and [2]. Money market instruments are mapped to the Government Debt class and modelled as short-duration FGN fixed income (1-year tenor).
Bibliography
[1] National Pension Commission (2026). Unaudited Report on Pension Funds Industry Portfolio, period ended 30 June 2026. Abuja: PenCom.
[2] National Pension Commission (2021). 2021 Annual Report. Abuja: PenCom.